🖼 Brooklyn Museum
Visitor Experience
Wayfinding Study
Wayfinding Study
Who needs a map?
Studying visitor behavior to find out how guests get around the museum.
Abstract
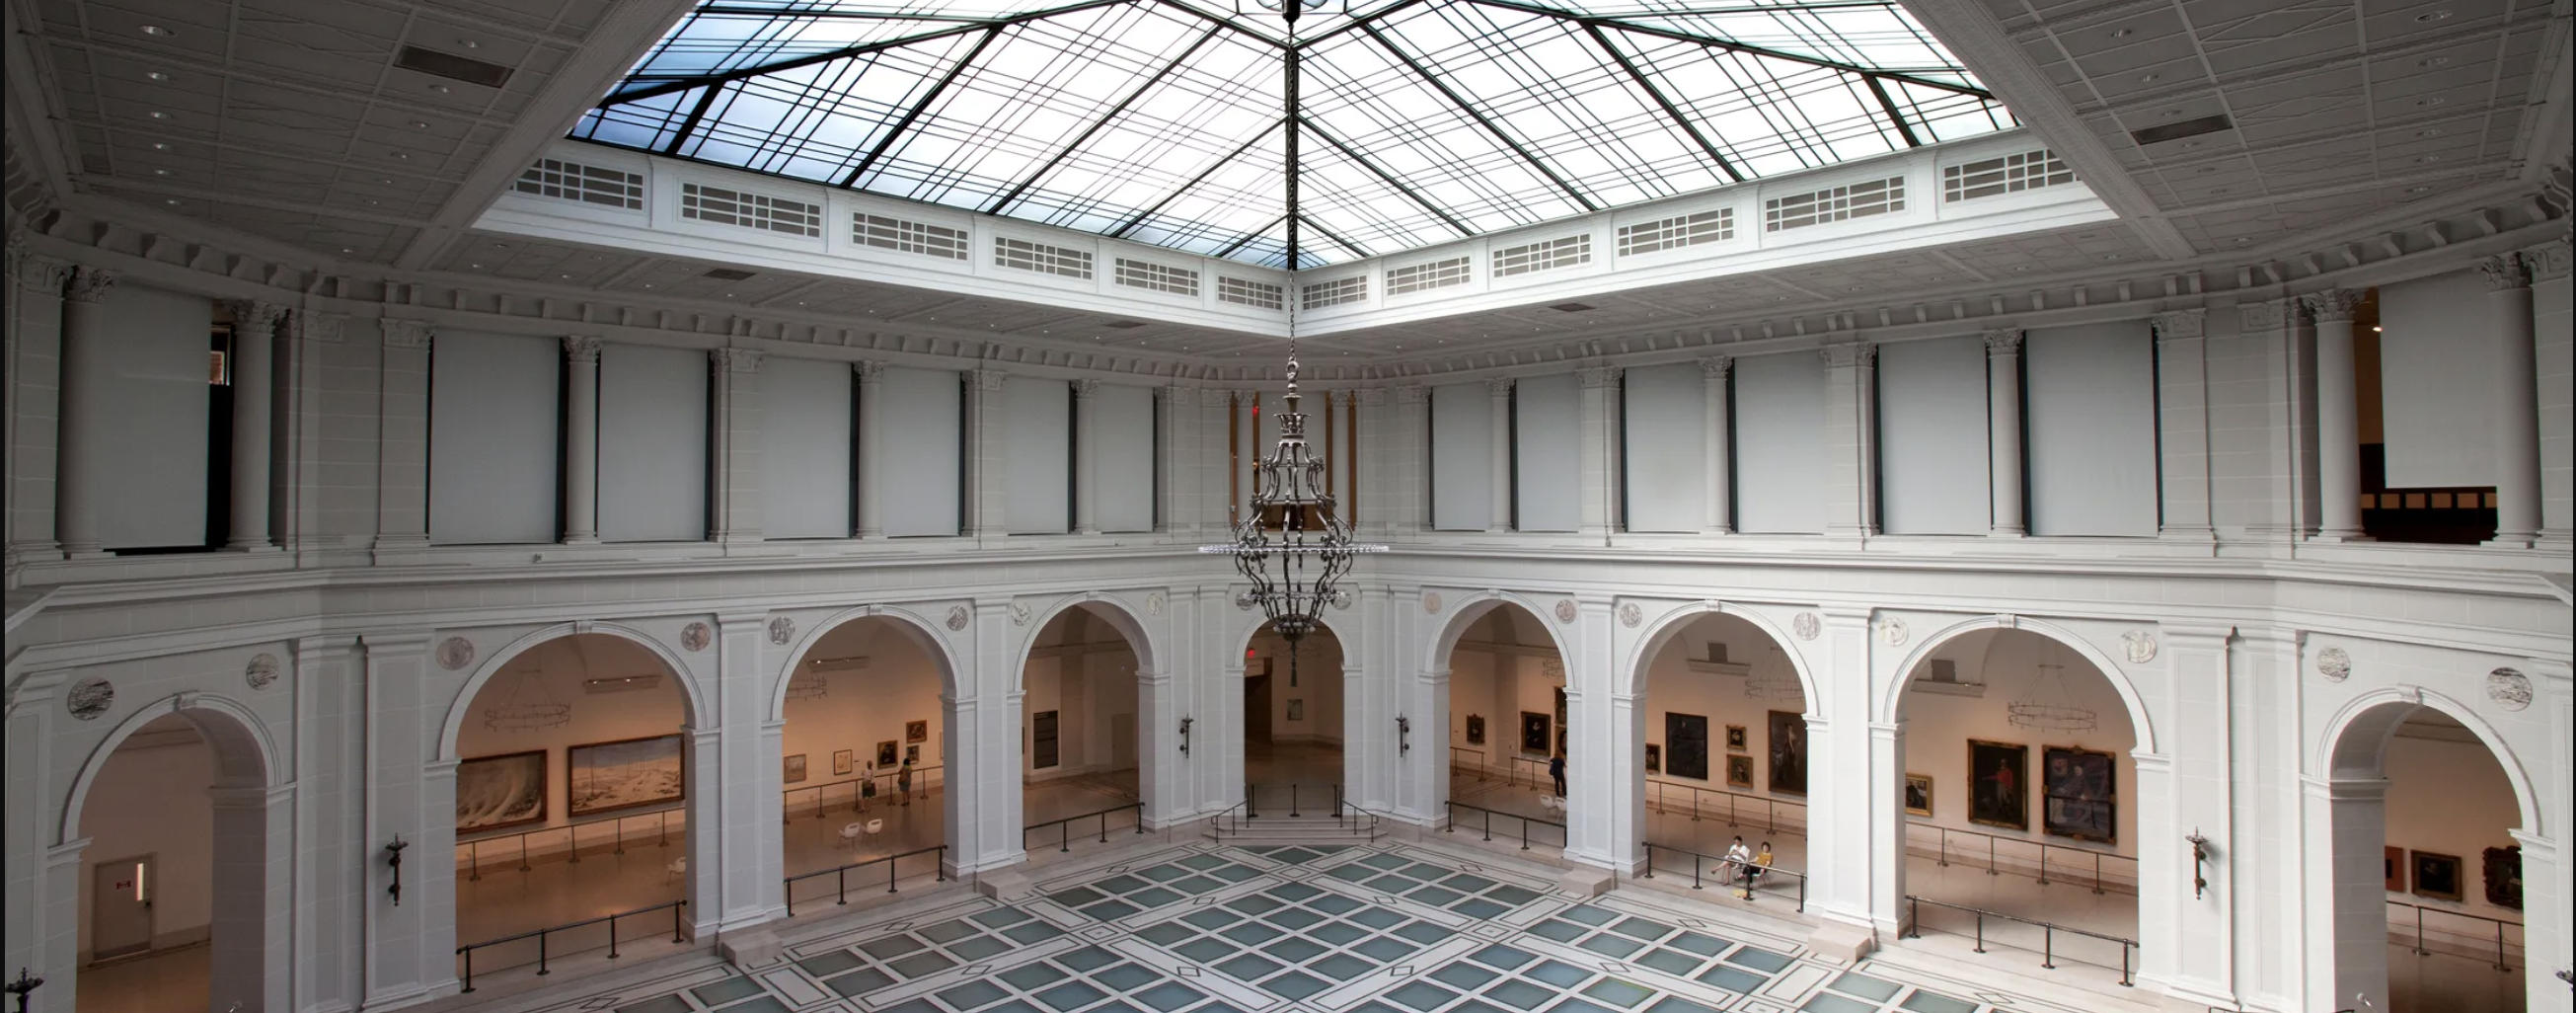
The Brooklyn Museum is New York City’s second largest museum in physical size and holds an art collection with roughly 1.5 million works. As such, the museum sought to understand how visitors find their way throughout different exhibition areas. During the COVID-19 pandemic, the museum stopped distributing paper maps. Our research team investigated where and how visitors use these maps in a controlled study to inform the museum’s decision whether to bring back paper maps in the Spring of 2021, or reshape the system entirely. With four other graduate researchers in Pratt’s School of Information, I created and executed a two-phase plan to study how visitors engage with maps during their time at the museum. To achieve this goal, the research was broken down into two phases: audience observation and survey.
Our findings were relevant in understanding where in the museum visitors rely on wayfinding tools, differences in map usage across various visitor types, and ranking the popularity of various wayfinding tools offered at the Brooklyn Museum.
Our findings were relevant in understanding where in the museum visitors rely on wayfinding tools, differences in map usage across various visitor types, and ranking the popularity of various wayfinding tools offered at the Brooklyn Museum.
 Our team
 Phase 1
The first phase was to observe where the visitors were using the map. To accomplish this, our team divided the museum into quadrants, and each quadrant was subdivided into different zones. We rotated throughout these assigned zones on the various floors of the museum, and simultaneously tracked visitors’ behaviors when using the map on tracking sheets we designed.
📚 Methods:
🏋️ My role:
- Contextual Inquiry
- Audience Observation
🏋️ My role:
- Study design
- Audience observation
- Collecting and coding data
- Graphic design
Phase 2
The second phase sought to understand how visitors were using the maps. All maps were distributed at three main entrances in the museum and the researchers observed the visitors as they took the maps. A paper survey was given to the visitors who had a map while exiting the museum. Also, a digital version of the survey was sent to all the visitors on specific dates when maps were also available. The data collected in this second phase helped the researchers get the bigger picture of visitors’ attitudes and thoughts towards using maps.
📚 Methods:
🏋️ My role:
- User Interviews
- Digital Surveys (SightX)
🏋️ My role:
- Survey and interview design
- Collecting and coding data
- Analysis and reporting
- Presenting our findings
How do visitors behave in the galleries?
Phase 1: Observational Study

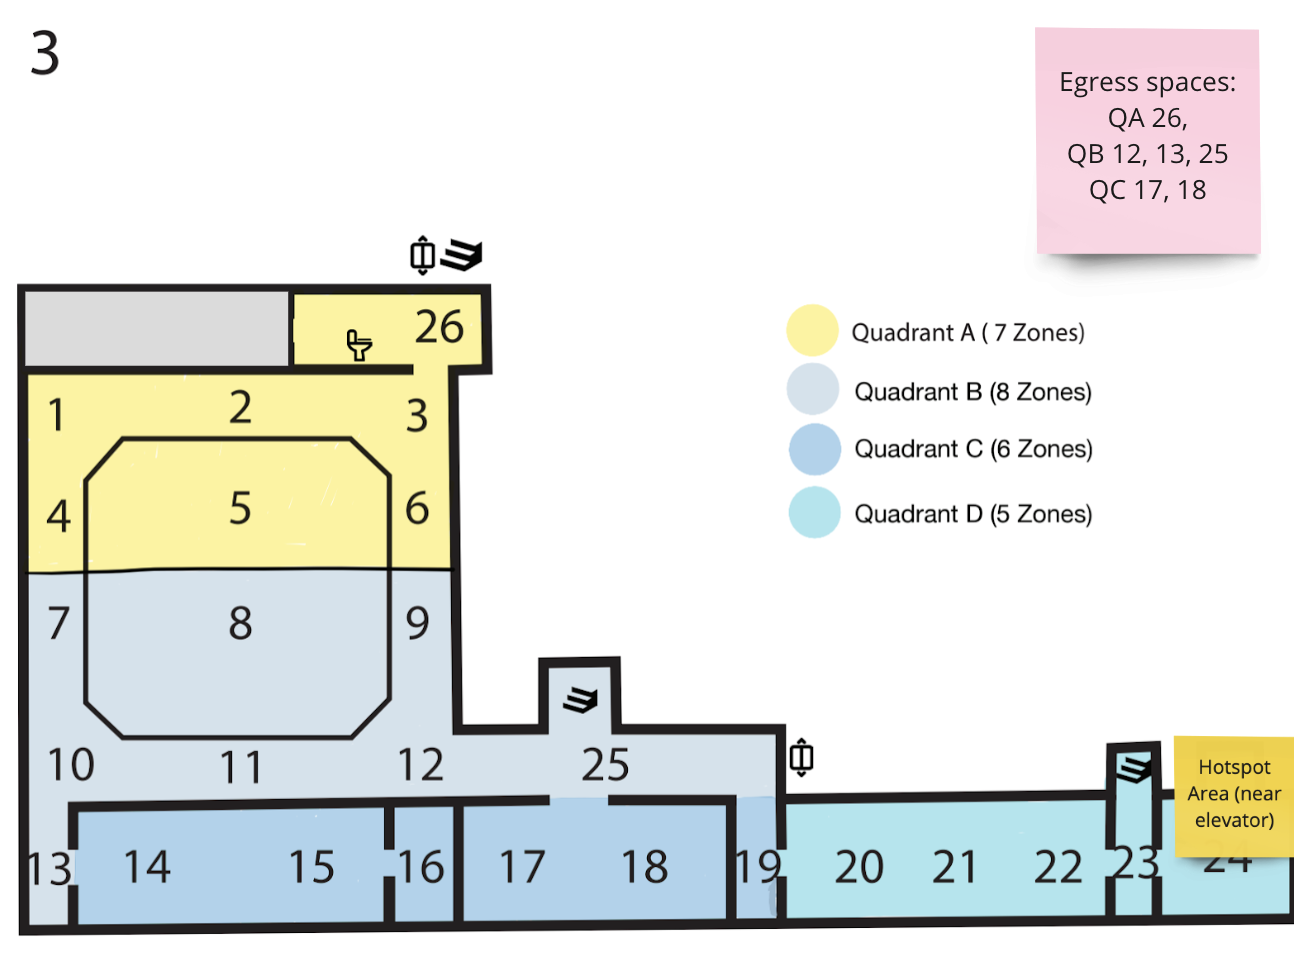
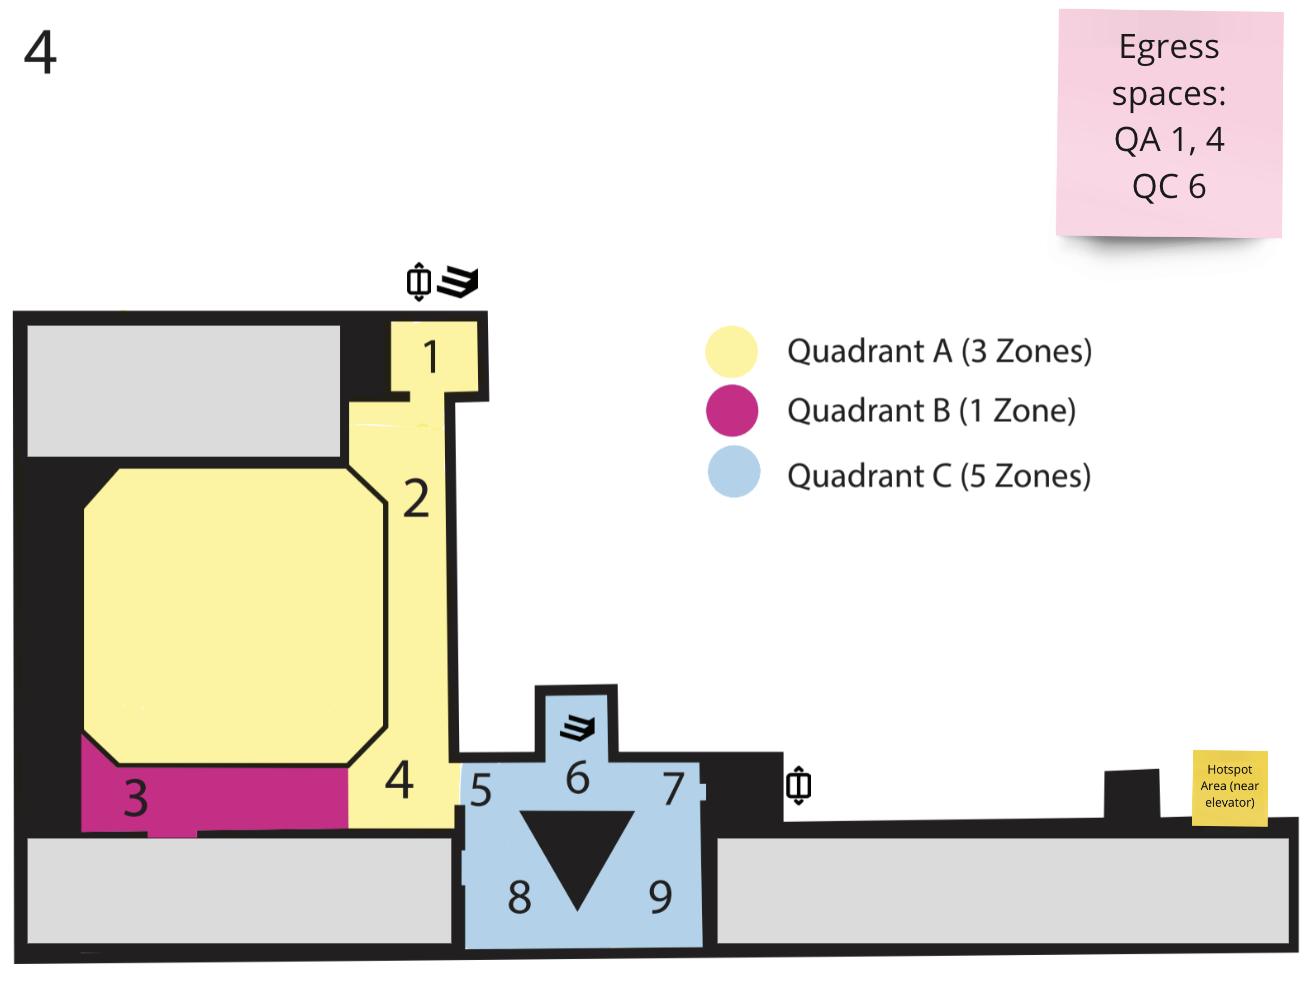
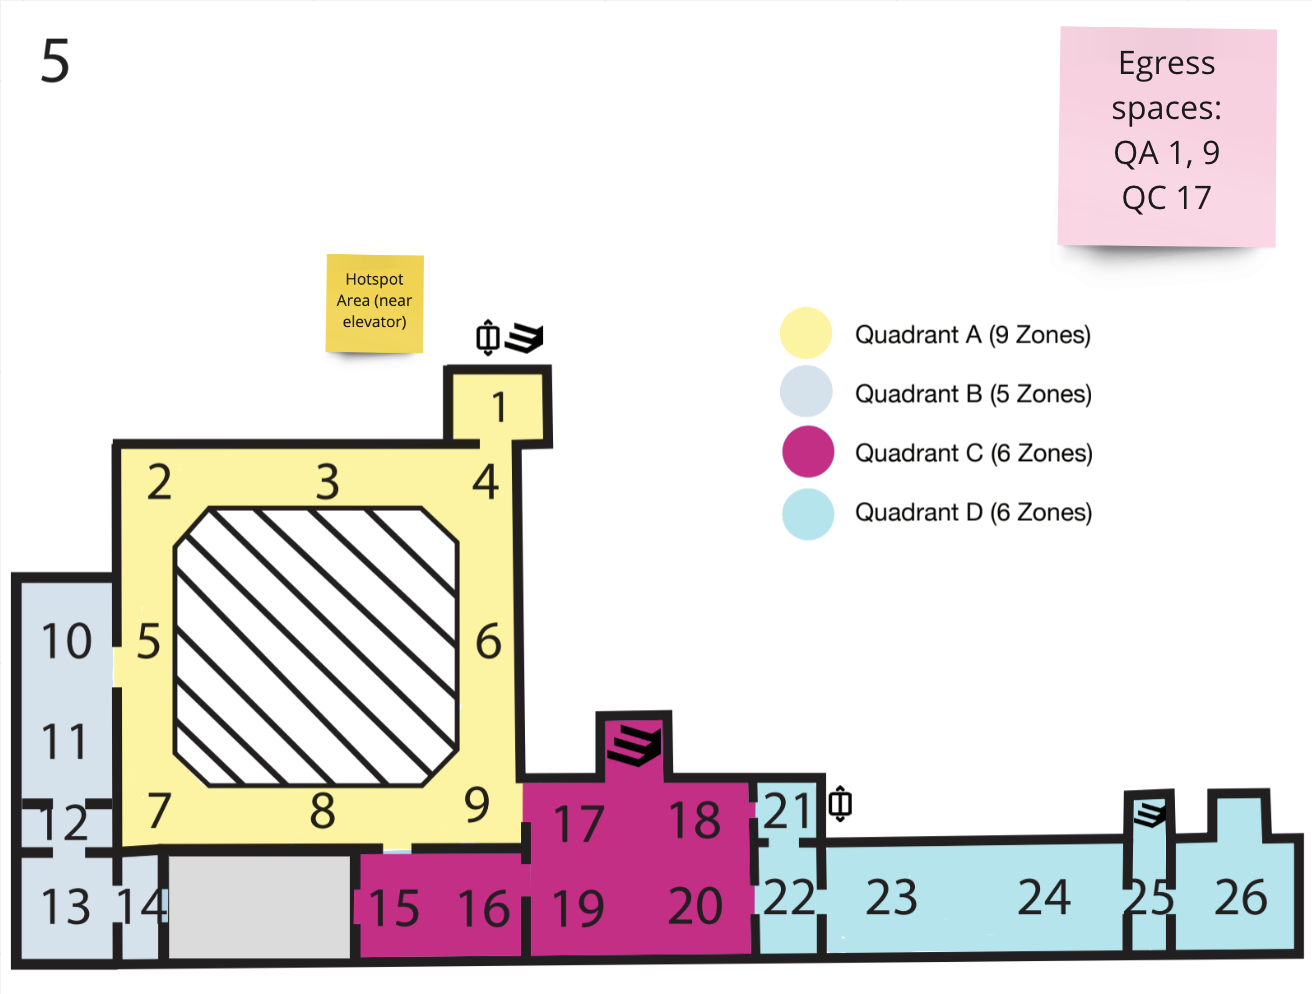
To begin our study, I drafted these floorplans to map out the open gallery spaces on floors 1, 3, 4, and 5. I then coded each into four quadrants with zone numbers to refer to specific locations in each gallery. We distributed maps at three controlled locations, two on the first floor, and one in the KAWS: WHAT PARTY exhibition on the fifth floor.
Over the course of three sessions, our researchers rotated through various floors and zones in 30-minute intervals, logging each instance we saw a visitor using a map.
Specifically, we each noted:
Over the course of three sessions, our researchers rotated through various floors and zones in 30-minute intervals, logging each instance we saw a visitor using a map.
Specifically, we each noted:
- Total number of maps taken
- The number of visitors noticed using the map actively (opening, reading, etc.)
- The number of visitors in possession of a map passively (in pocket, in hand, etc.)
- Time spent engaging with the map
-
Where the interaction was observed (quadrant, zone)
-
Additional factors such as how visitors were positioned when interacting with the map
(sitting, standing, etc)
-
Notable behavior (sleeping, playing with the map, gesturing, etc.)
- Any comments we heard related to the paper maps or other way finding devices (signs, museum staff, etc.)
We found that visitors relied on map the most in transitional spaces
(areas between galleries, or near egress points like elevators)
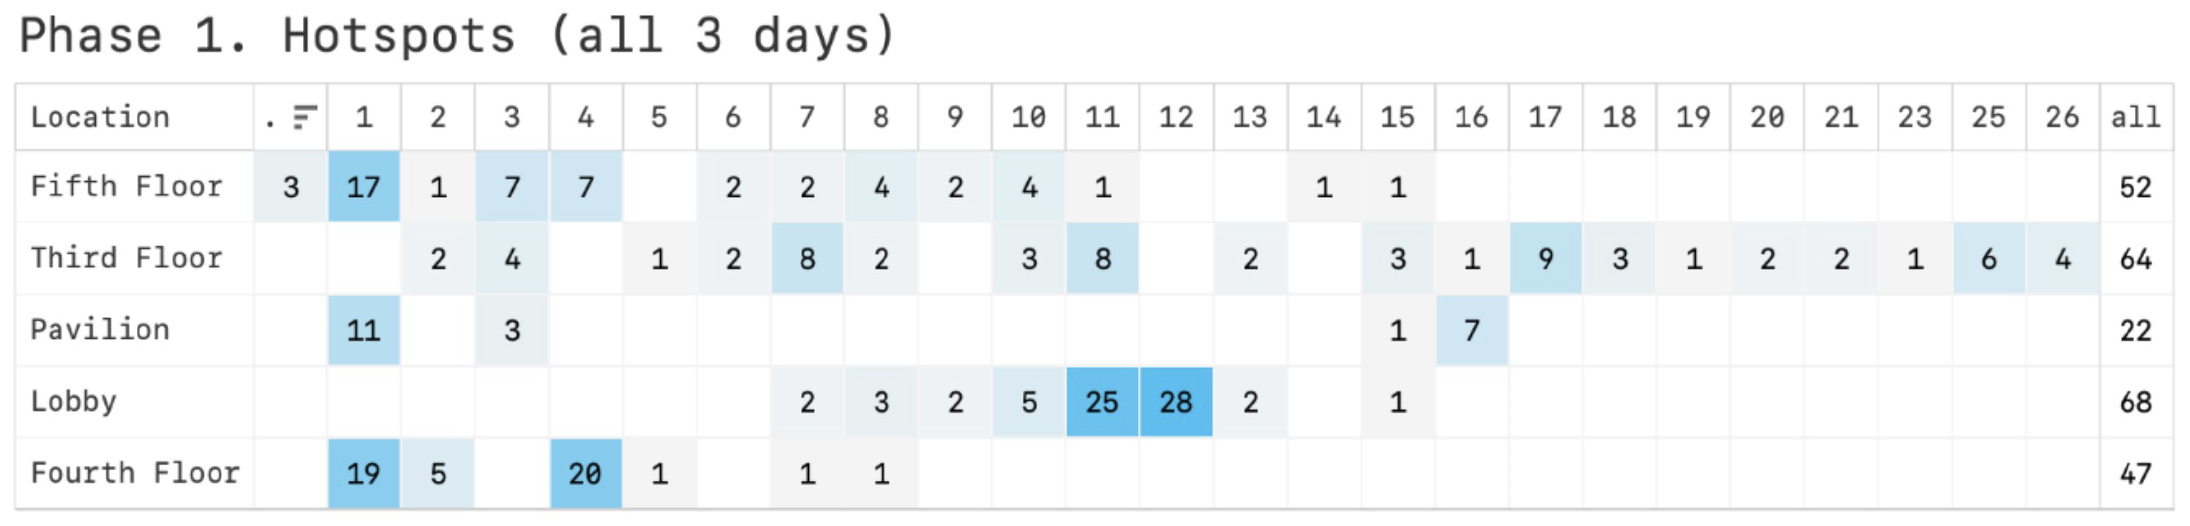
Each of the zones included on the chart above refer to a location within the museum and the total number of map interactions recorded in that area.
Hotspots:

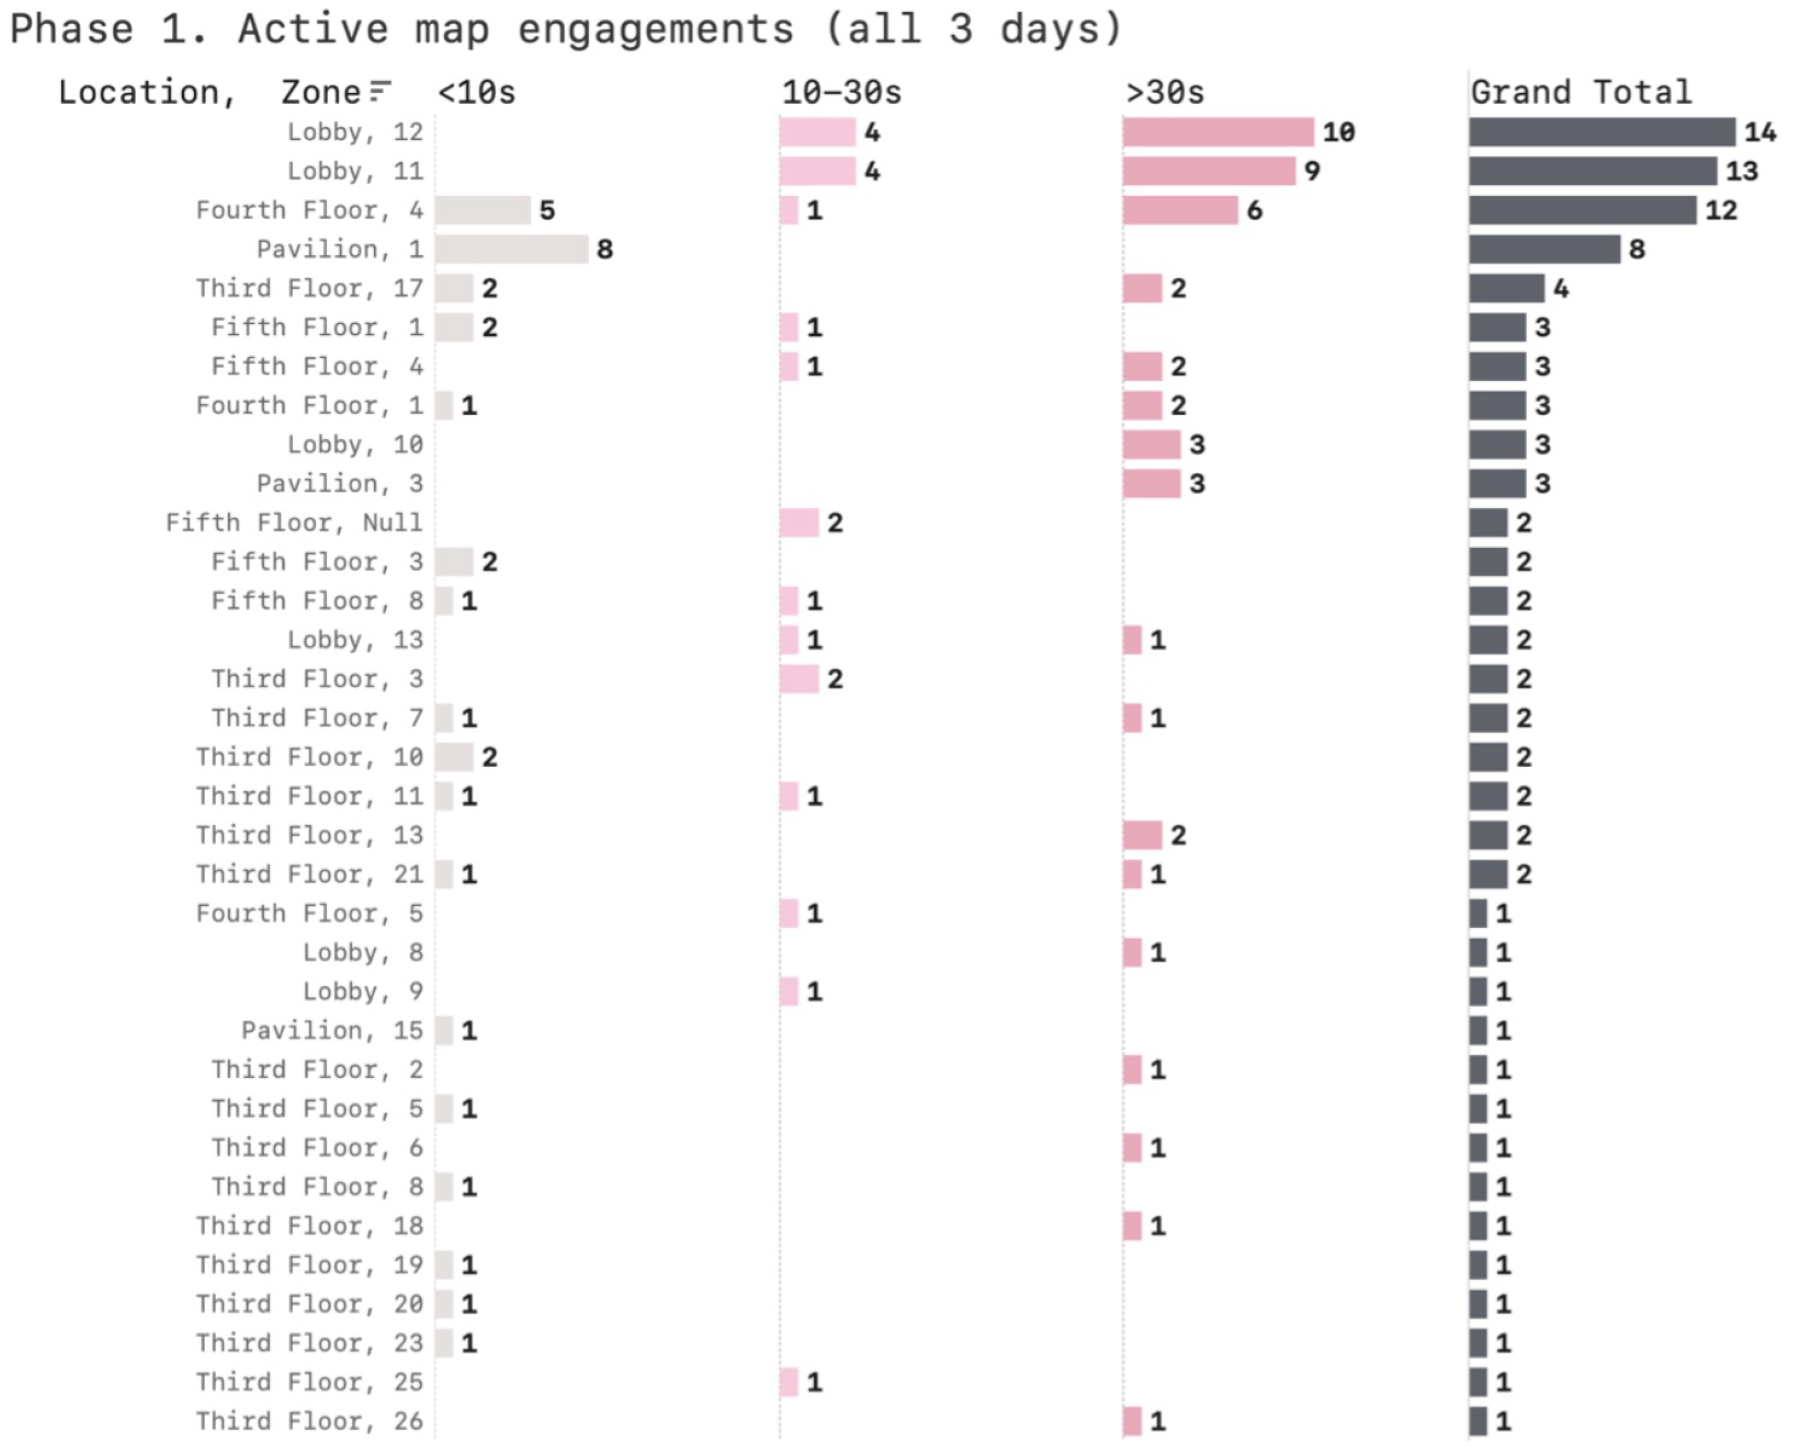
It’s also clear that
the highest number of long engagements (> 30 seconds) occurred in the lobby near the admissions
desk and lobby triptych. Conversely, the glass pavilion near the doors hosted the highest number
of average map interactions under 10 seconds. This indicates that visitors are most
interested in the paper map as a wayfinding tool when beginning their visit, but after the ticket
purchase.
What are visitors saying?
Phase 2: Visitor Interviews
To understand how visitors use the paper maps, we split this phase into two parts: in-person
interviews and digital surveying.
In-person interviews were conducted on the following days:
Visitors who attended on the following days were sent a digital survey:
Although we weren’t present to observe or conduct interviews on these weekend dates, the surveys allowed us to capture a larger sample of visitors than we would have otherwise.
In-person interviews were conducted on the following days:
-
Thursday, April 8th / 804 Total Visitors
-
Thursday, April 15th / 878 Total Visitors
Visitors who attended on the following days were sent a digital survey:
-
Saturday, April 10 / 1868 Total Visitors
-
Sunday, April 11 / 1361 Total Visitors
- Friday, April 16 / 1244 Total Visitors
Although we weren’t present to observe or conduct interviews on these weekend dates, the surveys allowed us to capture a larger sample of visitors than we would have otherwise.
Each day we distributed a specific number of maps across several locations in the museum. We used colored stickers to identify where each map was picked up throughout the visit.
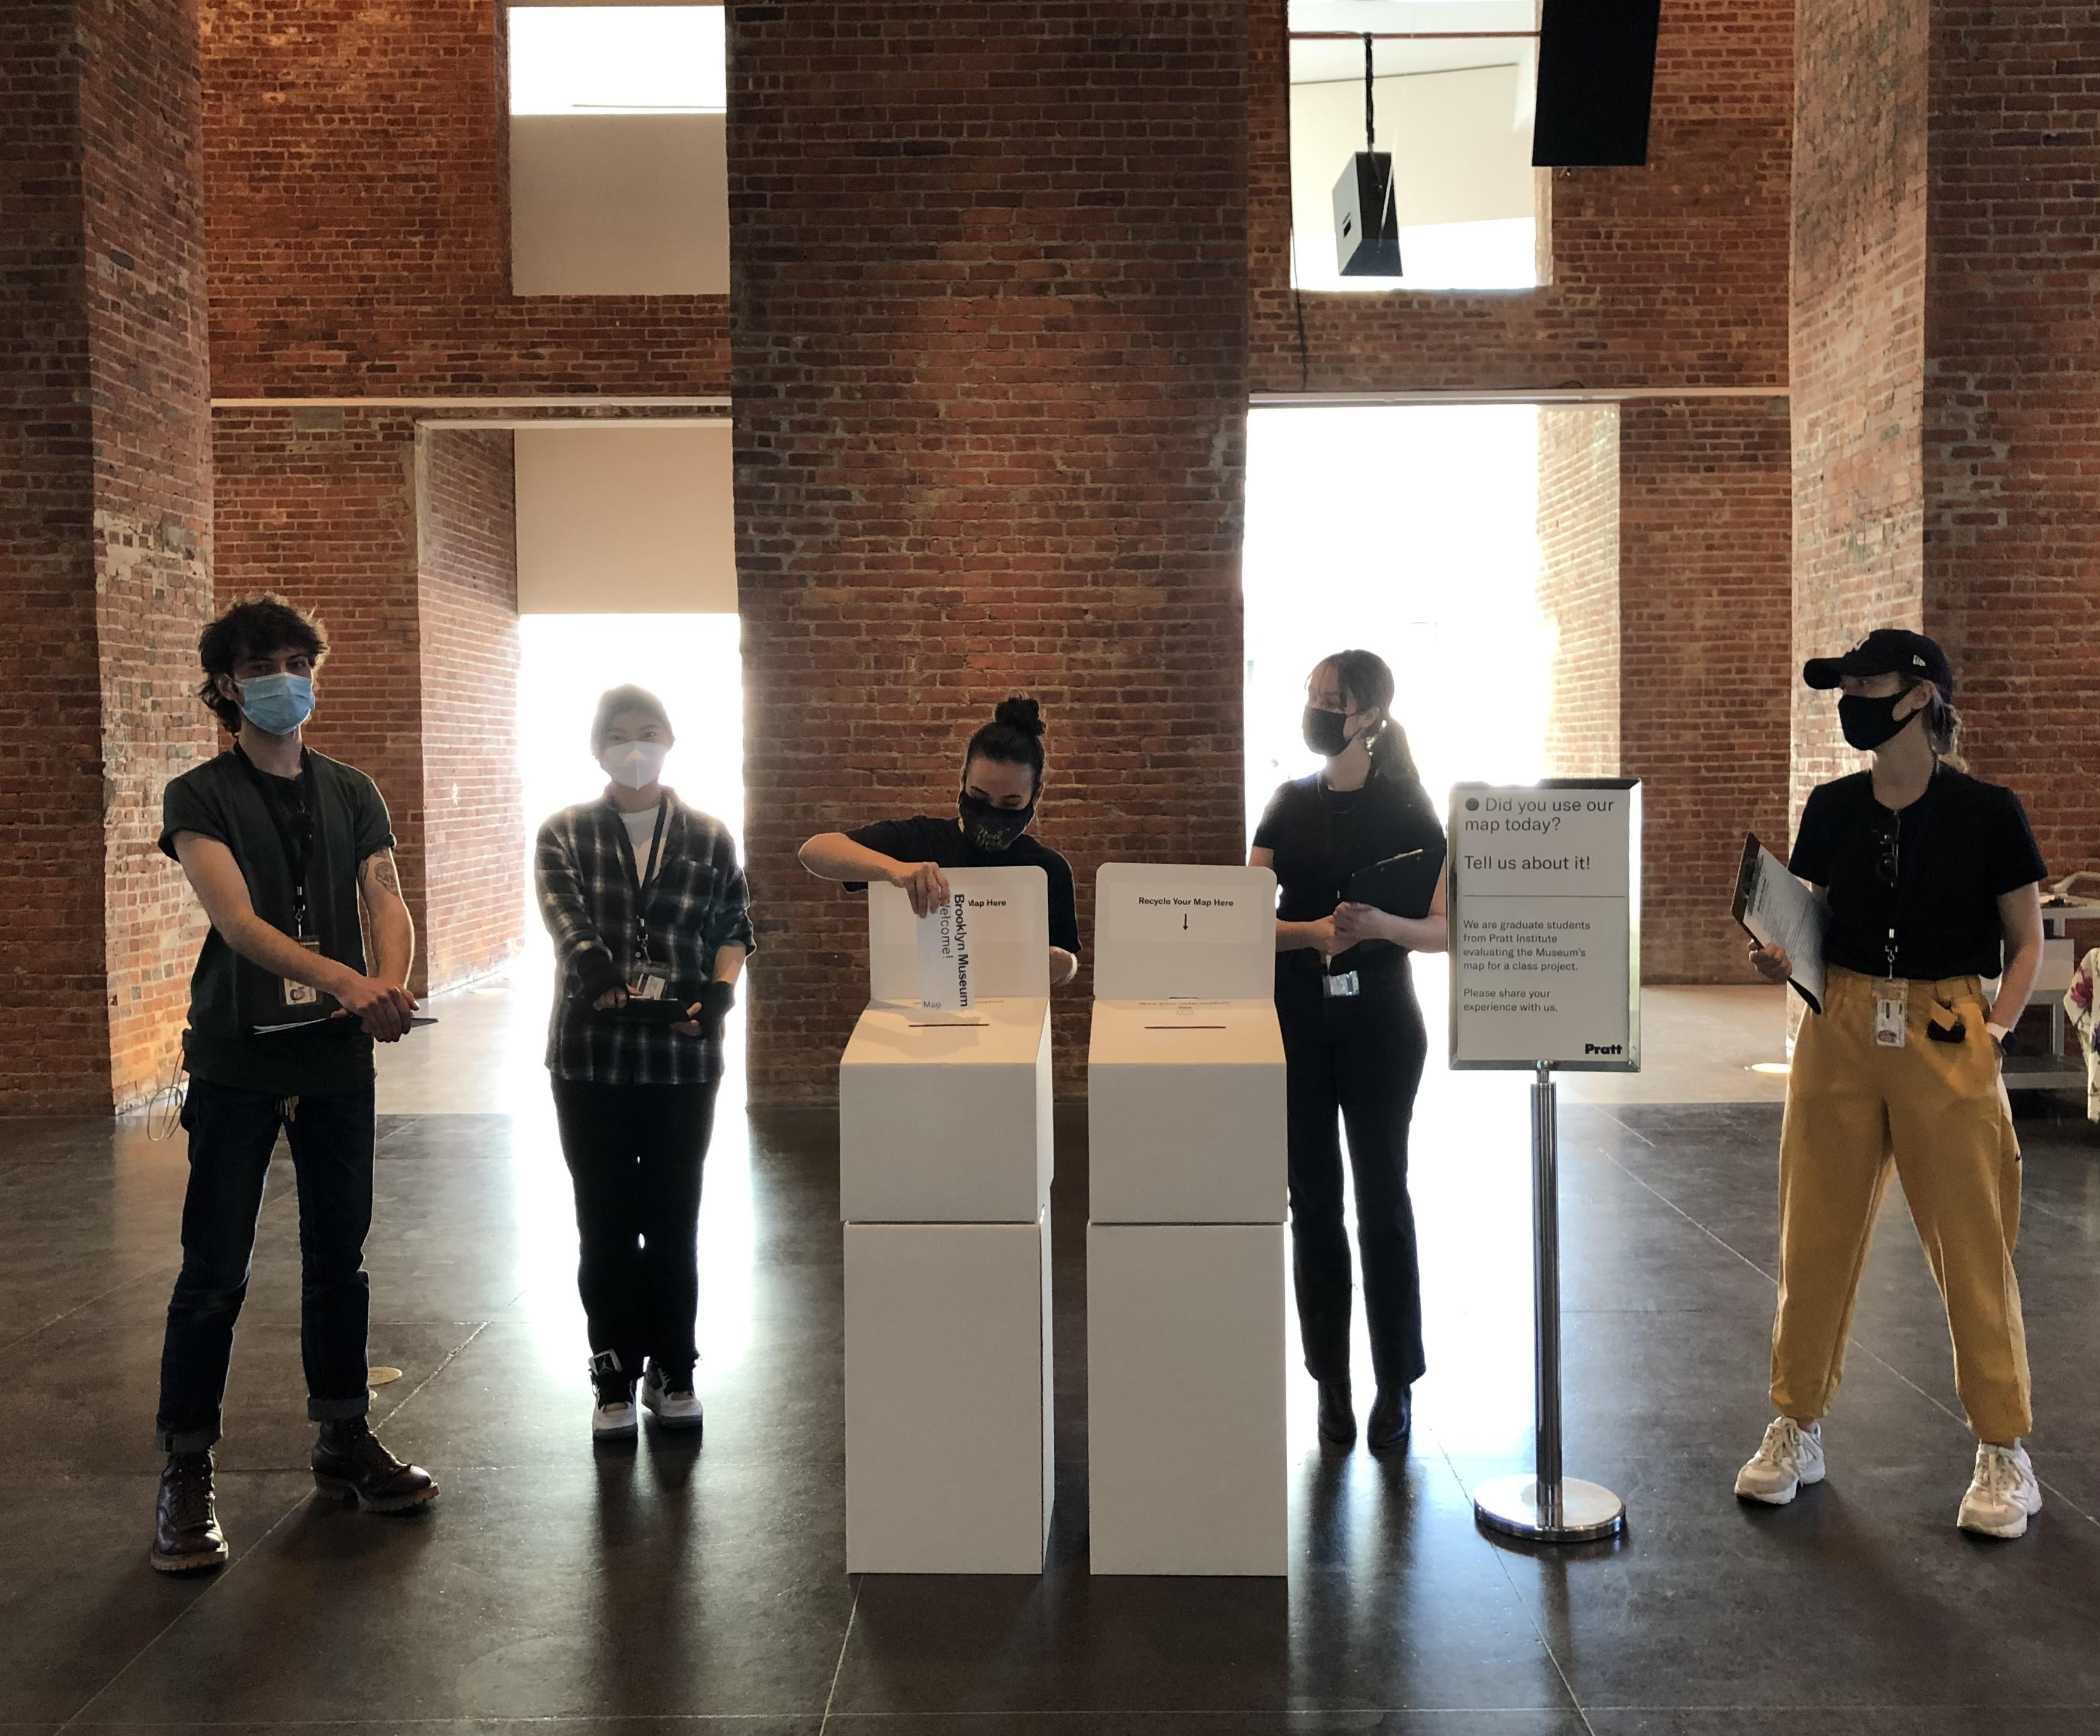
On the days in which the in-person interviews took place we positioned team members at a table in the lobby to flag down any visitors they saw leaving the museum with a museum map.
One observer was located at the elevator bay on the first floor to hand out museum maps to those who expressed interest (i.e. those who questioned where the KAWS exhibition was), one observer was positioned near the admissions desk to direct visitors on their way out to participate in the interview, and the last observer roamed the museum to let visitors know about the interviews being conducted, as well as the free gifts they could take in return for participating in the interviews.
Surveying & Interviewing Visitors
The purpose of the exit survey used in both in-person interviews and the digital survey was to understand how visitors used the map.
Survey Design:
- The first two
questions were included in order to validate the type of visitor who picked up the map.
- The third and fourth question were included to implicitly find out if the visitor experienced a situation when the map could have been used and whether they used the paper map to solve their problem.
- The fifth and sixth question were used to find out visitors’ opinion on the map if it was not
already revealed in the fourth question.
- The last question was used to determine if visitors wanted to keep the map.
The majority of visitors did not take paper maps.
Of the 78 visitors who responded to our digital survey, only 9 visitors took maps during their time at the museum.
24 of these guests did not take a map because they did not know about them, and the remaining 45 were not interested in taking a map.

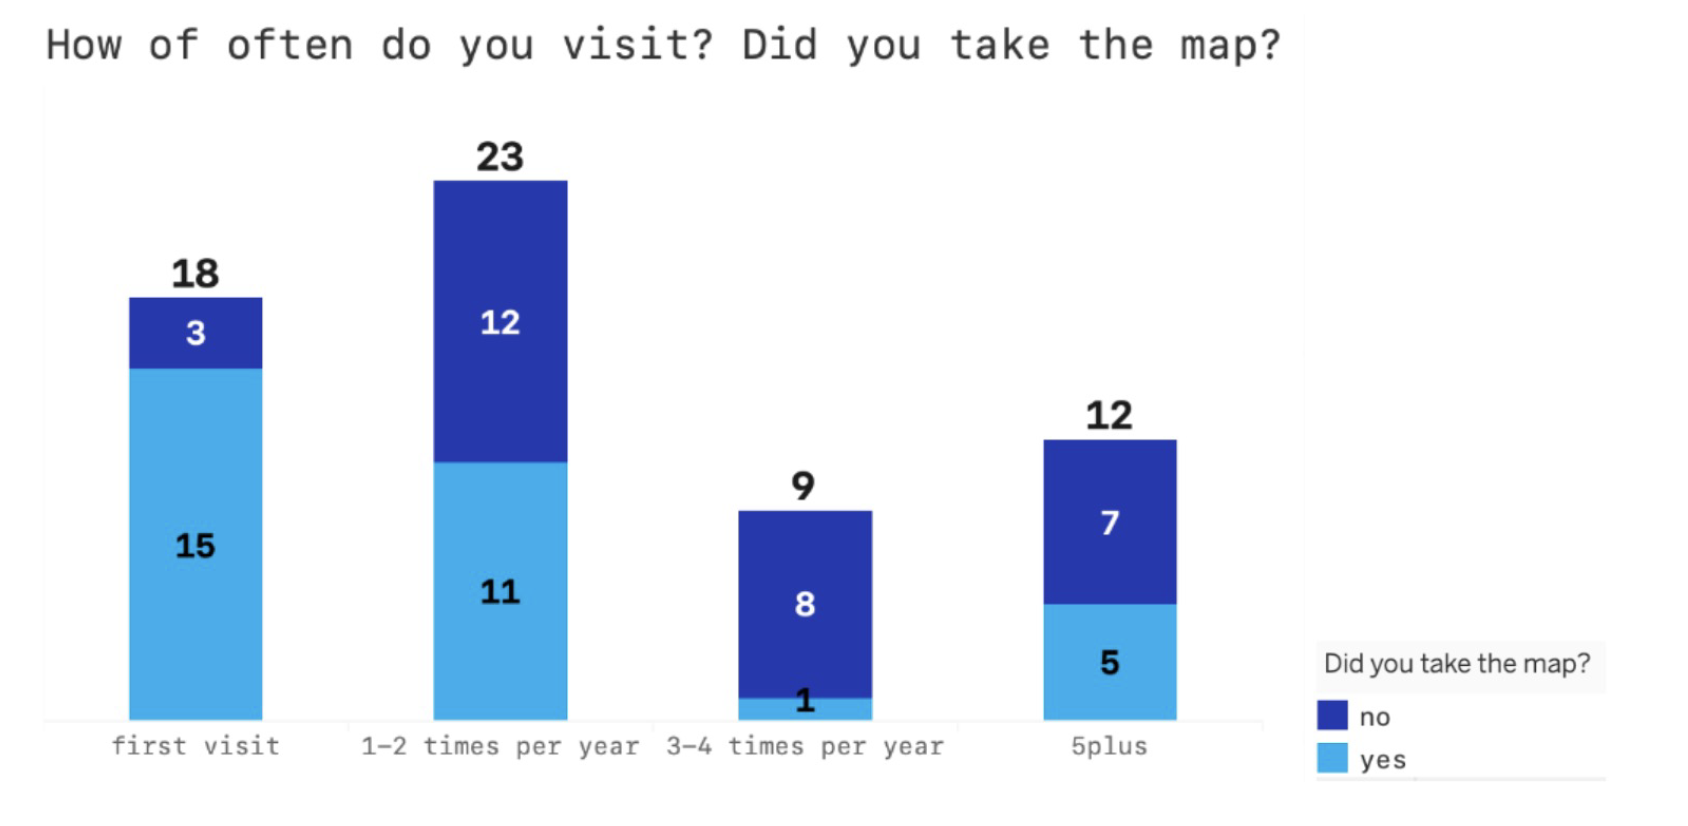
New visitors are most likely to take a map, but returning visitors also show interest
On the survey, 83% of our 18 identified first-time visitors indicated that they had taken a map during their visit. Although no other group of visitors took maps at the same rate, other visitors still took maps despite their familiarity with the museum.
A majority of non-members took maps, whereas members took maps less frequently
We find that 33 of 55 non-members took maps during their visit, while only 4 of 14 members picked up a map to navigate through the museum.
Map users had specific goals
![]()

Of the total respondents, we found that the majority of map-takers picked up the map anticipating to find specific areas within the museum.
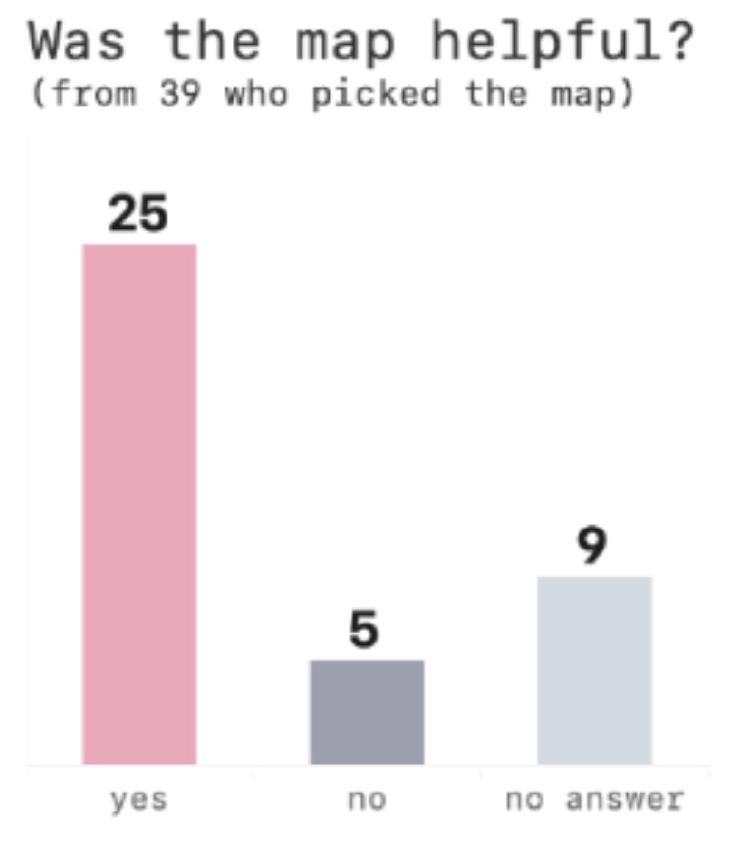
The map was a helpful tool
Of our survey respondents, a majority found the map to be a helpful wayfinding tool in navigating the museum, with only 5 of 30 respondents saying it was unhelpful.
Visitors appreciated information included about online programs and exhibits, updates about COVID-19 and floor closures, pictures of and information about the collection, the large dimensions of the map, and the ability to have a tool on hand to navigate through the museum.
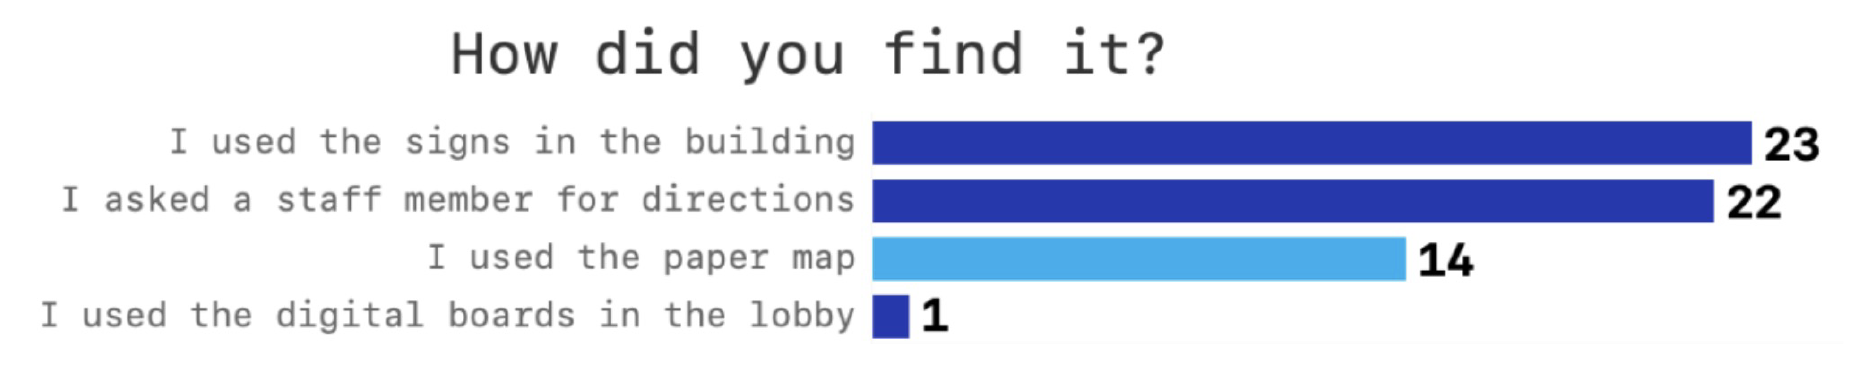
That said, it isn’t their first choice to get their bearings
When asked how they navigated to their points of interest, our respondents indicated that the paper map is their third most popular means of
wayfinding in the museum, behind posted signage.
This was a big finding for us! It indicates that visitors relied more heavily on other wayfinding tools than we expected initially.
This was a big finding for us! It indicates that visitors relied more heavily on other wayfinding tools than we expected initially.
Many guests take the map as a souvenir
In addition to our findings above, our study indicates that the map serves a secondary purpose to visitors as a souvenir—16 of 20 respondents indicated they intended to keep the map after their visit as a means of memorializing their trip to the museum.
Among these responses, visitors indicated an interest in using the map as a tool to plan their next visit, to put in a memory box, to read later, to share it with others, to use as a bookmark, and to use as an educational tool to review and discuss the art with their children. We distributed maps in five locations during our study: the security checkpoint in the Pavilion, the membership desk, the general admission desk, at the entrance to the KAWS: WHAT PARTY exhibition on the fourth floor, and at the check-out counter in the KAWS Shop. Guests took the highest number of maps from KAWS, followed by general admission, then the security checkpoint, and took the least from the membership desk.
One reason to explain why visitors took so many maps from the KAWS exhibition (despite the fact that the map did not have KAWS-specific navigation) was that it could be a free souvenir to memorialize their trip to this popular temporary exhibition.
Additionally, passive map interactions — meaning that visitors had their maps in hand or in pocket, not being read — comprised the majority (60%) of 253 overall interactions. This may indicate that visitors grab maps to have on their person and keep as a token, but do not rely on them heavily for wayfinding. For many visitors, having a map may give a sense of comfort, but they may never actually use the map unless they are unable to navigate sufficiently without using other wayfinding methods.

Recommendations
Our findings above indicate that, while paper maps are not necessary wayfinding
tools for visitors at the Brooklyn Museum, they are especially helpful to visitors unfamiliar with
the museum’s layout and are valuable as free souvenirs. In addition, our study demonstrated the need for an accessible wayfinding system throughout the museum. Due to our visitor
surveys and several observation sessions throughout the museum, we concluded that
visitors value assistance in wayfinding while beginning their visit and orienting themselves
within transitional spaces within the museum. These spaces include elevator bays, staircases,
and open spaces that feed into several different exhibits. Pursuant to these findings, we offer
three recommendations for the management of the Brooklyn Museum— one to further
investigate visitor behavior regarding wayfinding within the museum, one the case of keeping
the maps and one in the case that the museum decides to replace the maps with new
wayfinding tools.
1. Execute further studies to better understand wayfinding at the Brooklyn Museum
Regarding sample size...
One of the key limitations of our study was the sample size. We realized that more data ought to be collected before defining concrete recommendations from this study. The fact that Phase I was limited to observations during three sessions only allowed for a small glimpse into overall visitor behavior - not enough data to extrapolate conclusive results.
To glean more insight from visitor observations, we recommend another study in which the sample size is much larger. A study over the course of nine months, when the museum has returned to typical visitor capacity, would be sufficient. Furthermore, it is imperative to balance observation times between peak and off-peak hours on both weekdays and weekends. Were researchers able to record a significantly larger sample of several thousand wayfinding tool engagements, the results would be more conclusive.
Regarding data consistency...
An essential challenge of this study was how we learned and adapted as we went. As the observational phase progressed, my team and I also realized some challenges regarding how were were each logging our data. Another study should involve training sessions for researchers to establish consistent data coding and strict adherence to an outlined methodology.
If doing this again, we would implement standards for data collection to address cases in which visitors were double-counted by researchers observing on different floors; this could be addressed by establishing a coding key. Furthermore, standards for consistently noting active and passive interactions and visitors’ seated/standing orientation would improve the results’ validity.
Finally, my team learned during Phase I that distributing maps an hour before initiating observations was effective, but did not do so on the first observation session. Establishing standards to address these concerns at the outset would improve consistency of the overall dataset.
2. In the case that the Brooklyn Museum decides to keep the paper maps...
a. Redesign the paper maps for improved user experience
We noted that there are several aspects of the map that could be improved to help users engage more intuitively with the content and layout.
Our observations indicated that the map is most effective for active wayfinding use when completely unfolded because the full museum layout per floor can be seen while en route. To navigate effectively, visitors would open the map all the way while walking towards a destination or while seated and resting. However, the map is quite large when open all the way, and users prefer to hold the map while folded, focusing on the floor of interest. To alleviate this issue, the museum could redesign the map to feature each floor as a different facet of the map, rather than include all floors on one large page inside. This would eliminate the need to unfold the entire map to use it, and allow users to fold the map to display only the one floor they are currently on.
Additionally, the layout and information density can make it difficult for users to identify their own location relative to their intended destination, and the key can be confusing to interpret. One survey respondent told us that it can be difficult to ascertain their location, and would appreciate a key that is more intuitive. Similarly, by incorporating the suggestion to create a map page for each floor the updated layout could feature relevant information for visitors about collection highlights on their floor, as well as indicating restrooms, stairs, and elevators.
b. Distribute maps where visitors need them the most
It’s hard for visitors to predict where they’ll get lost!
Given that visitors clearly rely on wayfinding tools in transitional spaces, it would be very helpful to ensure that maps are available and visible on each floor in these locations. By distributing maps throughout these hotspot areas, the Brooklyn Museum could alleviate the confusion visitors encounter if they did not take amap at the beginning of their visit. We heard from a couple who took the survey that they did not anticipate needing a map, but would have appreciated to pick one up later on during their visit.
c. Make it easier to recycle unwanted maps
Our final recommendation in the case of keeping paper maps in circulation involved installing visible recycling bins specifically for collecting maps in the first floor hotspots and near exits so that the museum can lower the negative environmental impact of wasted resources. Given that there was a relatively even split between visitors that wanted to keep the map and visitors that would prefer to discard them, these stations could provide a clear location to incentivize recycling.
3. If the museum decides against reinstating paper maps...
a. Ensure that signage is up to date and features relevant information
Many visitors (35 of 41 survey respondents) relied on signage to navigate through the museum and orient themselves—specifically near elevator bays. If maps are to be removed from circulation, it’s really essential that the signage throughout the museum is updated frequently. A reported benefit of the paper maps was that they clearly indicate gallery closures and updates. While text-based wall signage can indicate what is available on each floor, it does not visually communicate floor layouts with relevant gallery closures and updates. One potential solution would be to install digital signage that includes a floor plan in elevator bays and navigational hotspots. However, an inherent limitation with this solution is that visitors cannot bring the map or floor plan with them. We also found that the digital signage installed in the lobby was the least popular wayfinding tool among respondents, and for this reason it may not be the ideal solution elsewhere. Although the two zones immediately near the lobby were hotspots for paper map use, only one of sixty survey respondents reported using the screens in that location. This may indicate a preference for alternative wayfinding methods over digital signage. To this point, further research could clarify visitor interest in digital signage.
b. Introduce digital wayfinding on mobile devices
For a solution that incorporates the benefits of a paper map without the negative environmental impact, we recommend exploring digital wayfinding tools that visitors could access on their mobile devices.
A common observation during our research centered around mobile phone use within the museum. Although it surpassed the scope of our study, we experienced presumably more active visitor engagement with cell phones than with paper maps. During Phase I, researchers noted a high percentage of visitors on their phones, especially when seated. As such, we expect the vast majority of visitors to already own a smartphone.
One solution would be to post identifiable QR codes throughout the museum which users could scan to access a floor plan of the relevant gallery or area. It would also be possible to include links to information about the collection, as well as additional resources to engage with the museum’s programming.
c. Replace the map as a souvenir
The most common reason that visitors decided to keep their maps rather than recycle them at the end of their visit was to commemorate the experience, followed by referring back to the map to revisit the collection further. Both of these cases demonstrate continued interest and engagement with museum programming, and help to create a positive, memorable association with the museum. If paper maps were to be removed from general circulation, we suggest continuing to offer limited edition maps as a souvenir from the gift shop.
During our observation phase, we picked up on the hype surrounding sold-out KAWS: WHAT PARTY merchandise, and the high rate of maps taken at the exhibition. Limited edition products that are specifically designed to accompany a temporary event elicit high interest from guests as a commodity. By creating limited batches of seasonal or exhibition-specific maps for purchase, the museum could create a culture of collecting around these items—much like Disney does with pins at their theme parks or MTA with brand partnership and their Metrocards. This could have the potential to ensure that repeat visitors feel an increased sense of loyalty to the Brooklyn Museum.